
Does Price-to-Book Still Work?
What the data actually says about returns

Context
I thought I would pen a quick article addressing the claim that “price to book investing doesn’t work anymore.” Accompanying that claim is usually the explanation that, in the modern era of software, tech and IP, the world is now about intangibles.
That argument has merit. The world is definitely different from when Benjamin Graham operated and relied on book value as a core part of his philosophy.
However, to say it doesn’t “work anymore” is not only a massive oversimplification, it’s just not true. I hope this article can demonstrate that.
Approach
To do so, I am using a platform called Portfolio123, a quantitative investing tool that lets you design, backtest, and run rules-based stock and ETF strategies using point-in-time fundamental, technical, and analyst data.
I can run a simple 10-year backtest to test how effective a price-to-book-based strategy really is.
Firstly, my universe is all European markets, with a minimum daily average liquidity of $10,000 (resulting in a universe of over 4000 stocks). This removes tiny nanocaps and odd skews in the data, although I would argue the smallest parts of the market are exactly where alpha is more available, if you can access them.
I also cap the maximum gain from any single stock at 500%, which avoids results being distorted by a lucky 10 or 20 bagger. Although again I would argue, large right-tail events are part of the deep-value game.
There are a few other minor background rules to keep things “fair,” but I won’t bore you with the details.
Lastly, the universe is split into 20 buckets and rebalanced annually.
As for how those buckets are formed, in this article I present two backtests.
Results
The first uses a composite value rank.
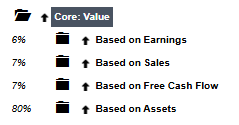
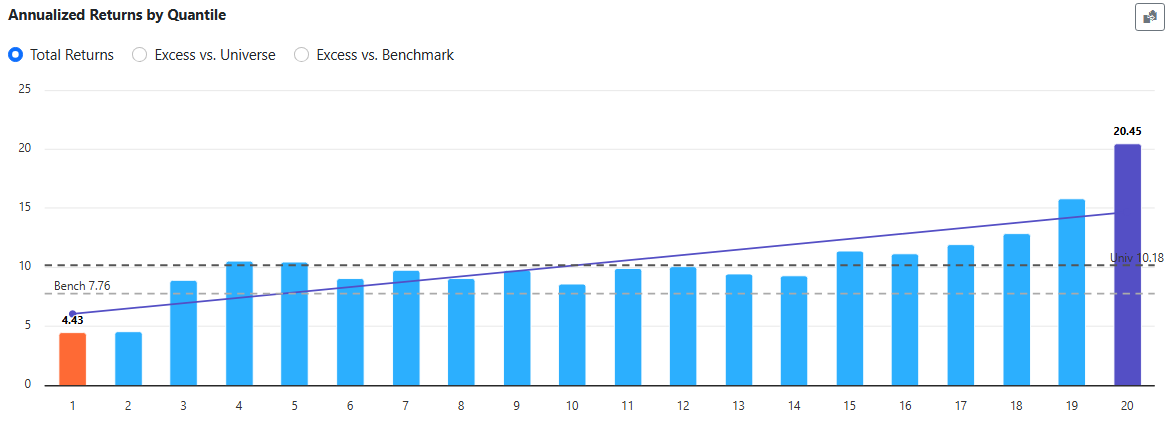
I am oversimplifying slightly, but in essence, all stocks in the universe are scored based on their P/E, P/S, P/FCF, and P/B ratios. As shown in the image, the ranking system is heavily skewed toward assets, with a 80% weighting on P/B and smaller weights on the other value metrics.
Using a pure systematic approach, buying the top 5% of stocks (i.e. the cheapest 5%) and rebalancing annually, produces an annualised return of 16.4%. This is vs the universe which achieved a 10% CAGR over the same time period.
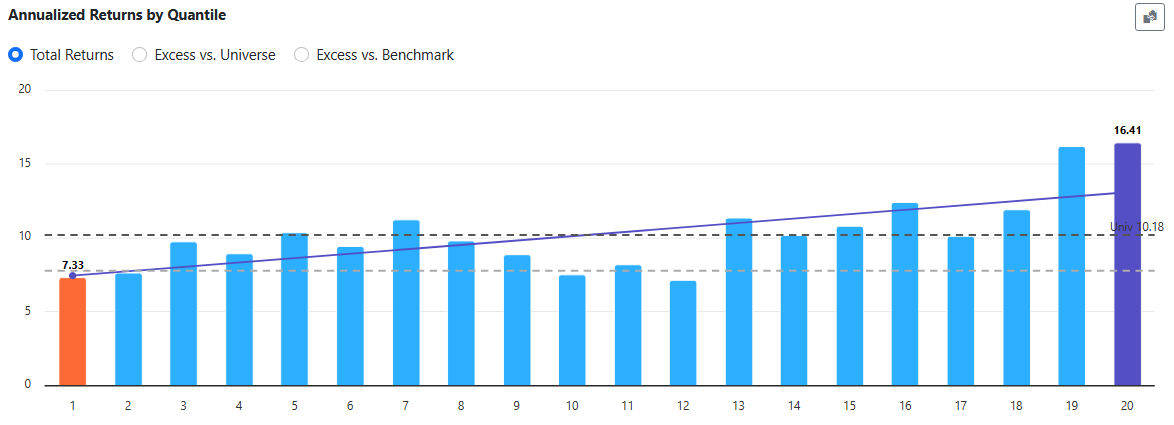
Notable outperformance. Not bad for a strategy that supposedly “doesn’t work anymore.”
Maybe it’s a sign of the times (ironically, I’m drafting this on the same day as the SpaceX IPO), but a 16.4% CAGR doesn’t seem to impress people as much as it should these days. So it’s worth putting that into context.
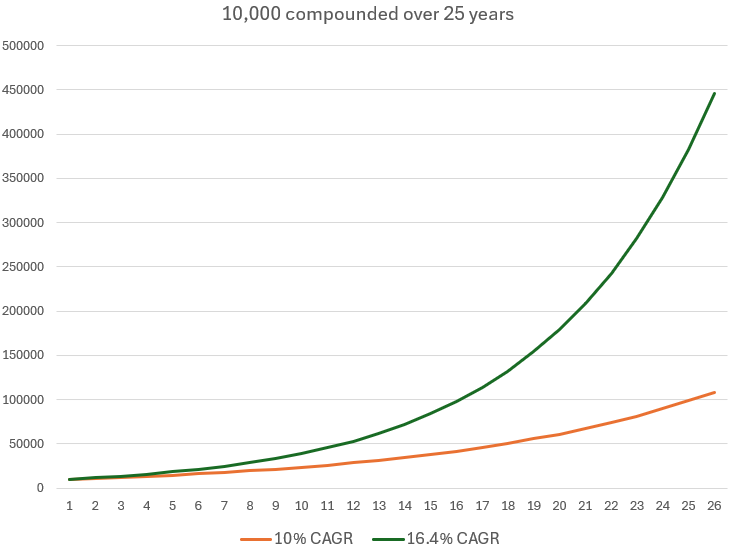
10,000 compounding at 10% - roughly the long-term market average and coincidentally what the all-stock universe achieved - grows to about 108,000 over 25 years. At 16.4%, that becomes 445,000 - over 4x greater.
So even a very crude backtest looks fairly compelling.
If we take it one step further and add the Piotroski F-Score into the composite, the results improve again.
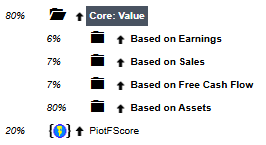
For those unfamiliar, the Piotroski F-Score is a 0–9 checklist of nine binary accounting signals designed to assess a company’s financial strength and direction of fundamentals. In short, higher is better.
Including it introduces a light “quality” overlay to the value composite. It helps filter out many of the weakest balance sheets and most obvious dogs with deteriorating fundamentals.
The purpose here is to show that if you focus on the cheapest P/B stocks but apply a level of fundamental analysis, you end up fishing in a better pond.
In other words, exactly what this Substack is trying to do.
With this addition, the top 5% bucket delivers an annualised return of 20.45% (vs 16.4% previously)
Returning to our earlier graph, that equates to roughly 1.04m over 25 years.
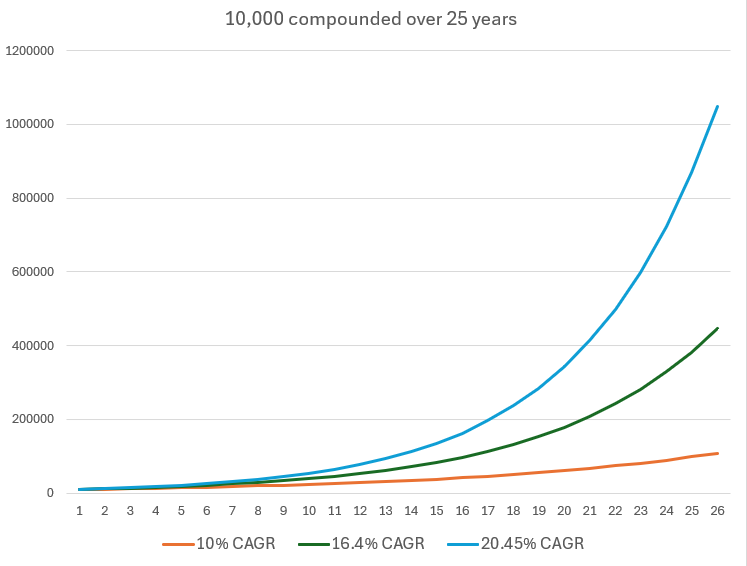
I have resisted all urges to put a rocket emoji on the chart.
Interestingly, I could take this further. Adding momentum factors pushes returns into the mid-20s, but I’m not a quant and this Substack isn’t about building factor models.
Conclusion
The point of this article was to show that price-to-book investing still very much works.
This is the part of the market I focus on. By layering qualitative analysis on top: understanding strategy, capital allocation, and reading the transcripts others ignore, I aim to identify the gems within that universe.
I can’t guarantee a 25%+ CAGR, but that’s the hunting ground and that’s the aim.
Disclaimer:
As always, please do your own research.
The companies discussed often involve complexity or risk, and outcomes can vary widely. Investing in small/micro-cap stocks carries a high risk of capital loss.
This post is for informational and educational purposes only and does not constitute financial advice.
This is a cool study/backtest. I wanted to do a back test in python inclusive of stocks that were taken private/acquired which means tickers that are no longer present today but I was never able to find a good data source for it.
Low P/B, NCAV, Liquidation value has always worked because it's a protection of capital mechanism. You just have to apply a bit of judgment on the quality of the balance sheets/margin of safety.
Interesting piece. A few additional remarks:
- In the original Piotroski study, the main factors contributing to the outperformance of the F-score were straightforward: positive earnings and positive operating cash flow.
This makes sure that the book value does not decrease over time.
BTW: The American Association of Individual Investors (AAII), for example, runs a long term low price-to-book strategy combined with positive earnings. Positive earnings are a "quality factor " for AAII.
- The quality of assets is also important. For instance, current assets such as cash and receivables are often more valuable than fixed assets. However, real estate (fixed assets) can also be highly valuable.
- Ideally, you would capitalise and amortise past R&D (and other expensed intangibles), adding them back to the book value. However, the calculation is more complicated.
- A low price-to-book ratio is probably more prevalent in small stocks, so the outperformance may be related to small-cap and value factors.